INTRODUCTION
Friction as an important physical effect required a lot of theoretical and experimental work to be understood (Qi et al., 2011; Cozza, 2014). To understand the physical effect of friction in any process, it is necessary to consider in detail both the theoretical and experimental study of the process (Ceschini et al., 2006). The friction mechanism between abrasive particles and abraded material is more complicated than the mechanism between one particle and abraded material. The random process between a rubber wheel and sand particles can cause a linear motion of the particles if their interaction maintains the rotation. Applying a rotational movement linearly and with the interaction between the particle and the material could cause sliding of the material and one of the aspects of the sliding process is friction and friction coefficient.
If the frictional force acts at a distance, it causes energy loss which converts to heat and in practice, for example, the friction between a chisel and soil increases fuel consumption。
The value of the friction coefficient depends on the boundary conditions of the particles and sliding material. If the size of the particle is small, the microstructure phase and adhesion phase influence the boundary conditions. For instance, there is the assumption that the microstructure of a metal with two very different phases such as solid solution and intermetallic has a different friction coefficient than a microstructure with a solid solution. The total friction energy consumption as well as other indicators were determined based on the size of the frictional force. The density of friction energy represents the amount of friction energy in relation to a friction stressed amount of mass. The density of friction energy, the intensity of wear, and the mean shear stress are the indicators that determine the critical energy level which characterizes the friction process (Ceschini et al., 2006; Ku?era & Chotěborsk?, 2013). Although there are publications focused on the abrasive wear of a multiphase material, the authors only described the relationship between the microstructure and volume loss of the materials (Chotěborsk? et al., 2009a; Chotěborsk? et al., 2009b; Kazemipour et al.,2010; Petrica et al., 2013a; Wang & Li, 2010; Sabet et al., 2011) as well as the test condition and the volume loss of the materials (Jankauskas & Skirkus, 2012; Chotěborsk?, 2013; Petrica et al, 2013b).
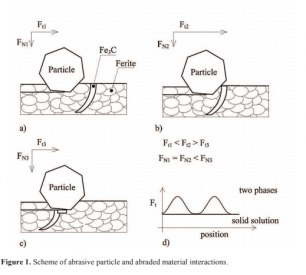
The goal of this article is the evaluation of an abraded material with respect to the influence of microstructure characteristics on the friction force (Fig. 1) and friction coefficient.
MATERIALS AND METHODS
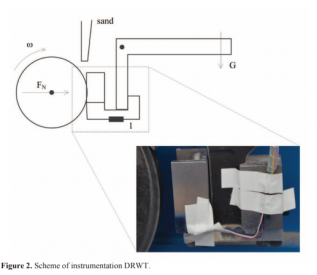
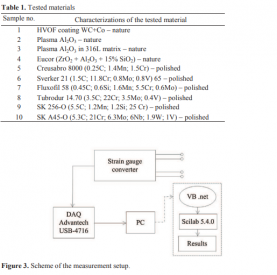
A dry rubber wheel tester (DRWT; Stevenson, 2005) was used for evaluation of abrasive wear. The lever was placed in the deformation member with a strain gauge as shown in Fig. 2. A calibrated strain gauge was joint into the converter and DAQ Advantech USB4716 (200 kSa s-1) and the data was moved to a PC as is shown in the schema in Fig. 3. The data (more than 500 MB files) was evaluated by SciLab 5.4.0 where the scripts for frequency, amplitude and mean of friction force analyses were respectively examined.
In Table 1, the materials used for the abrasive wear test are shown. These materials were grouped by their typical structure characteristics. The first group of tested materials was coated with very hard particles in structure. HVOF coating tungsten carbides in cobalt matrices (sample no. 1) where the ratio of hard particles was higher than 90 volume percentage. Plasma spray coating alumina oxide (sample no. 2) and plasma spray coating alumina oxide particles in metal matrix (sample no. 3) content particles > 90 volume percentage. Both alumina oxide ceramics materials were hard but very brittle and in this case there is the presumption that the adhesive strength is small between the phases in composite. Material Eucor (sample no. 4) is a mixed ceramics material with particles of alumina oxide and zirconia dioxide vitrified with silicon dioxide. The second group were materials without large hard phases, Creusabro 8000 (sample no. 5) is abrasive wear steel with martensitic structure and a small ratio of retained austenite, Sverker 21 is tool steel with martensitic structure and small chromium carbides in martensitic matrices, Fluxofil 58 (sample no. 7) which is a hardfacing material with martensitic matrices after weld depositing. The third group of tested materials were high chromium hardfacing deposits, Tubrodur 14.70 (sample no. 8) which is a hardfacing deposit with large chromium-rich carbides in eutectics matrices, SK 256-O (sample no. 9) is hardfacing similar to sample no. 8 with higher amount of large chromium-rich carbides in matrices, SK 45-O (sample no. 10) is hardfacing material similar to the previous and the microstructure amount of chromium-rich carbides and particles of niobium carbides, the ratio of chromium-rich carbides are also similar to sample no. 8. The samples were cleaned in ultrasonic bath after the test and mass loss was measured with the accuracy of 0.1 mg. The volume losses were determined from the density of tested material by the hydrostatic method.
RESULTS AND DISCUSSION
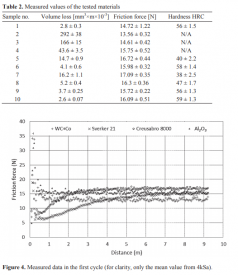
The experimental results are presented in Table 2. The values of volume loss represent how many cubic millimeters are given out per one meter of test distance. Friction force and its standard deviation were calculated from all measurements. The standard deviation values showed a change in friction force at varying measurements. The hardness of the tested material was determined by a standard Rockwell tester at a 150 kg load. Ceramic materials were very brittle and it was not possible to use the measurement using the Rockwell’s method (Type C).
In Fig. 4, the effect of friction force on the first cycle measurement of the different materials is illustrated. Ceramic materials such as alumina oxide plasma spray coating achieved the lowest friction force. In this case, the cohesion of the structure spray coating was small and cracking with abrasive particles was possible (Sarikaza,2005; Gok, 2011). The resistance passing through the particles was small and the kinetic energy of abrasive particles was transferred to cohesive failure. The wear rate was stable as a result of the dependency between friction force and distance (Fig. 4) for the total test time. The amplitude of the dependency between friction force and distance was small indicating that cohesion failure needs small energy. The volume loss of alumina oxide plasma spray coating was very high, but metallic matrices can increase wear resistance. It seems that alumina oxide in metallic matrices showed higher cohesive strength. The comparison of the ceramic materials showed a correlation between volume loss and friction force. The last material in this group,WC + Co composite, obtained small volume loss and friction force due to the higher fracture toughness of a HVOF composite. Indentation of abrasive particle into material was small corresponding to the small friction force. A higher number of passage particles is needed for the wear mechanism. Analyses of abrasive particles indicate that sand particles were broken. Comparing the volume loss and friction force at the same test time, the volume loss decreased with increasing friction force. It seems that a higher worn surface led to a higher area. For sand crashing, friction force increased intensively because crashing process requires high energy consumption. The amplitude of the dependency between friction force and distance was high, which could be due to sand crashing.
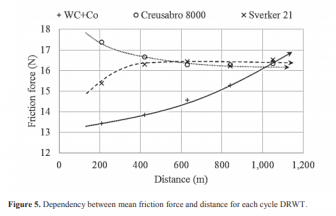
The results of the second group of materials showed that single-phase microstructure (without minority phases) partly indicated some correlation between friction force, hardness and volume loss. The worn surfaces were grooved with a different roughness. The roughness value depended on hardness because the ploughing mechanism depends on the indentation depth of the abrasive particle. The dependency between friction force and distance was stable while the amplitude was small, indicating that the abrasive particle thus shifts rather than the combination of rotating and shifting. This also indicates that sand particles had no influence due to lack of failure. Important behavior has been found as it was observed that the friction force on sample no. 5, decreased with the test distance (Fig. 5). This material showed a small amount of retained austenite, due to the wear mechanism and loading, with strengthened surface. On the other hand, the samples no. 6 and 7 had strengthened surfaces before the test because they were polished and this strengthened layer was worn before the test (Fig. 5).
The results of the third group of materials showed multiphase microstructure with high toughness although it had small volume loss but high friction force. The dependency between friction force and distance was not stable and the amplitude was high, indicating that sand obtained higher fracture toughness than chromium-rich carbides into matrices. Hardfacing and carbides also showed failure rather than sand.
The analysis of the used sand after the test showed no failure.
CONCLUSION
Evaluation of the abrasive wear process by a modified rubber wheel instrument revealed the following results:
· For single phase materials like steel, the friction force can represent wear since the friction force is proportional to the volume loss. Also, strengthening can be analyzed during the wear process.
· For multiphase materials like cast iron or metal matrix composite, the friction force, frequency and amplitude can represent cohesive strength between the hard phase and matrices. With a material with high cohesive strength, the abrasive particle can also break.
· The limitation of using the rubber wheel method is the natural frequency of the system. In this study, the natural frequency was found to be 200 Hz and this frequency is necessary to eliminate the algorithm for frequency and amplitude during wear analysis. Additionally, this phenomenon increases the requirement for the computation or hardware component such as memory capacity.
 WeChat platform on the scan
 Copyright:Qinsun Instruments Co., LTD! Qinsun Instruments Co., LTD!Provide technical support Enterprise email